Introduction
This lab will focus in on the cartographic fundamentals of creating maps. These fundamentals include a north arrow, scale bar, locator map, watermark, data sources, and metadata. Without these cartographic elements, the map quality becomes poor, and the reader is left assuming things, or not knowing certain things. Most of these elements are pretty self explanatory such as a north arrow, a locator map, and a scale bar, but the rest are not. All a watermark consists of is the map creator's name which shows that they created the map. The data sources can consist of where the data came from, what tools were used to collect the data, and of other important information related to the data displayed on the map. The metadata can include what the data was collected with, an item description of the map, the extent of the data, and other important information.
Part one of this lab will consist of revisiting the sandbox spline interpolation. Four oblique angles will be given of the spline interpolation. One hillshade will also be included. Emphasis will be put on including the fundamental cartographic elements. There will be some discussion about the patterns seen on the maps.
Part two of this lab will include four different maps of the Hadleyville cemetery. The first one will show the year of death for each grave. The second will display the last name on each grave, the third will who whether a grave
is standing or not. The fourth map will be a graduated circle map related to the year of death for each grave. For each map, some discussion will be generated, and an emphasis will be put on including the cartographic fundamentals.
Part I: Sandbox Terrain
Figure 3.0 shows the different maps of the sandbox terrain. The top four maps are spline interpolations created in ArcScene. The sandbox has our main regions which can be most easily seen in the hillshade map. They are the northwest, northeast, southeast, and southwest. In the southwest there is a large plains region with a small depression in the very southwest corner. This is the most boring region of the sandbox as elevation change is fairly minimal when compared to other regions. The southeast region has two main depressions, a small but steep hill, and has the main valley located in it. The northeast region contains the large ridge, and large depression. The elevation change between the ridge and the depression and valley is very high. The northwest region has a small valley, a depression, and a hill. The elevation changes between these features is not as great as the change in elevation in the northeast or southeast regions. Overall, the maximum height of the sand was 128 mm, the lowest point was 0 mm, the mean height was 67 mm, and the standard deviation was 25 mm.
Part II: Hadleyville Cemetery
 |
| Fig 3.1: Year of Death by Grave at Hadleyville Cemetery, Data collected in September of 2016. |
This map displayed in figure 3.1 shows the year of death by grave at the Hadleyville cemetery. By eyeballing the year death labels, it looks like the oldest graves are located in the central part,in the western part, and in the extreme southeastern part of the cemetery. Younger graves are located in the northeast and northwest sections of the cemetery.
 |
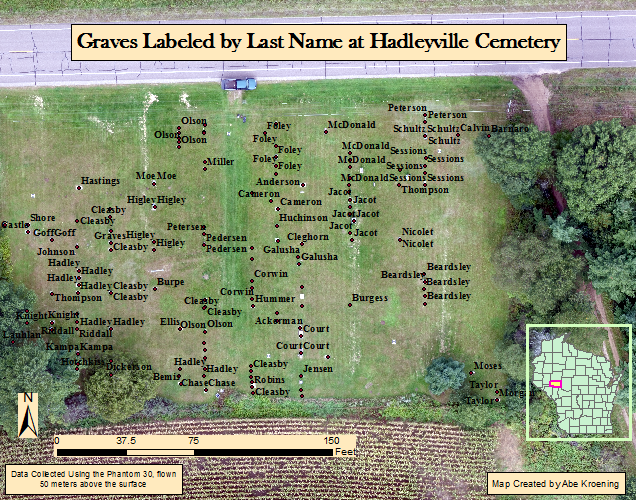
| Fig 3.2: Last Name by Grave at Hadleyville Cemetary. Data collected in September of 2016 |
The map above (figure 3.2) labels the graves with the last name of the person buried there. Generally, people of the same family tend to be buried in the same location. This holds true when looking at the map. For example, the Olson family is buried in the north northwest corner, the Beardsley family is buried in the southeastern area, and the Schultz family is buried in the northeast corner. Other than families being buried near each other, no other spatial patterns seem present.
 |
| Fig 3.3: Grave Standing Status at Hadleyville Cemetery. Data collected in September of 2016. |
This map (shown in figure 3.3) displays the grave standing status. If the grave is standing, then grave circle is green. If a grave isn't standing, then a red circle represents it. If there isn't any data about the grave standing, then the grave circle is white. Surprisingly, only five graves were not standing. It seems that the grave status is linked to the family last name. For example, all of the Jacot graves don't have any data, while all of the Olson's, Schultz's, Beardsly, and McDonald's graves are standing.
 |
| Fig 3.4: Graduated Symbol Map of the Year of Death by Grave. Data Collected in September of 2016 |
This map displayed in figure 3.4 shows the year of death by grave in a numeric fashion. The larger the circle, the more recent the death. The small the circle, the older the death. Looking at the map, large circles tend to be grouped with large circles while small circles tend to be grouped with small circles. one example of this is in the northeast region where there is a group of large circles. Another is in the central region where there is a group of small circles.
In all of the Hadleyville cemetery maps not all the metadata is included. One piece of the metadata which is missing is the camera type which was used on the Phantom 30 to collect the data. Metadata is an important component which helps give the data useful background information.
Sources
US Census Bureau, Fact Finderhttps://factfinder.census.gov/faces/nav/jsf/pages/index.xhtml

No comments:
Post a Comment